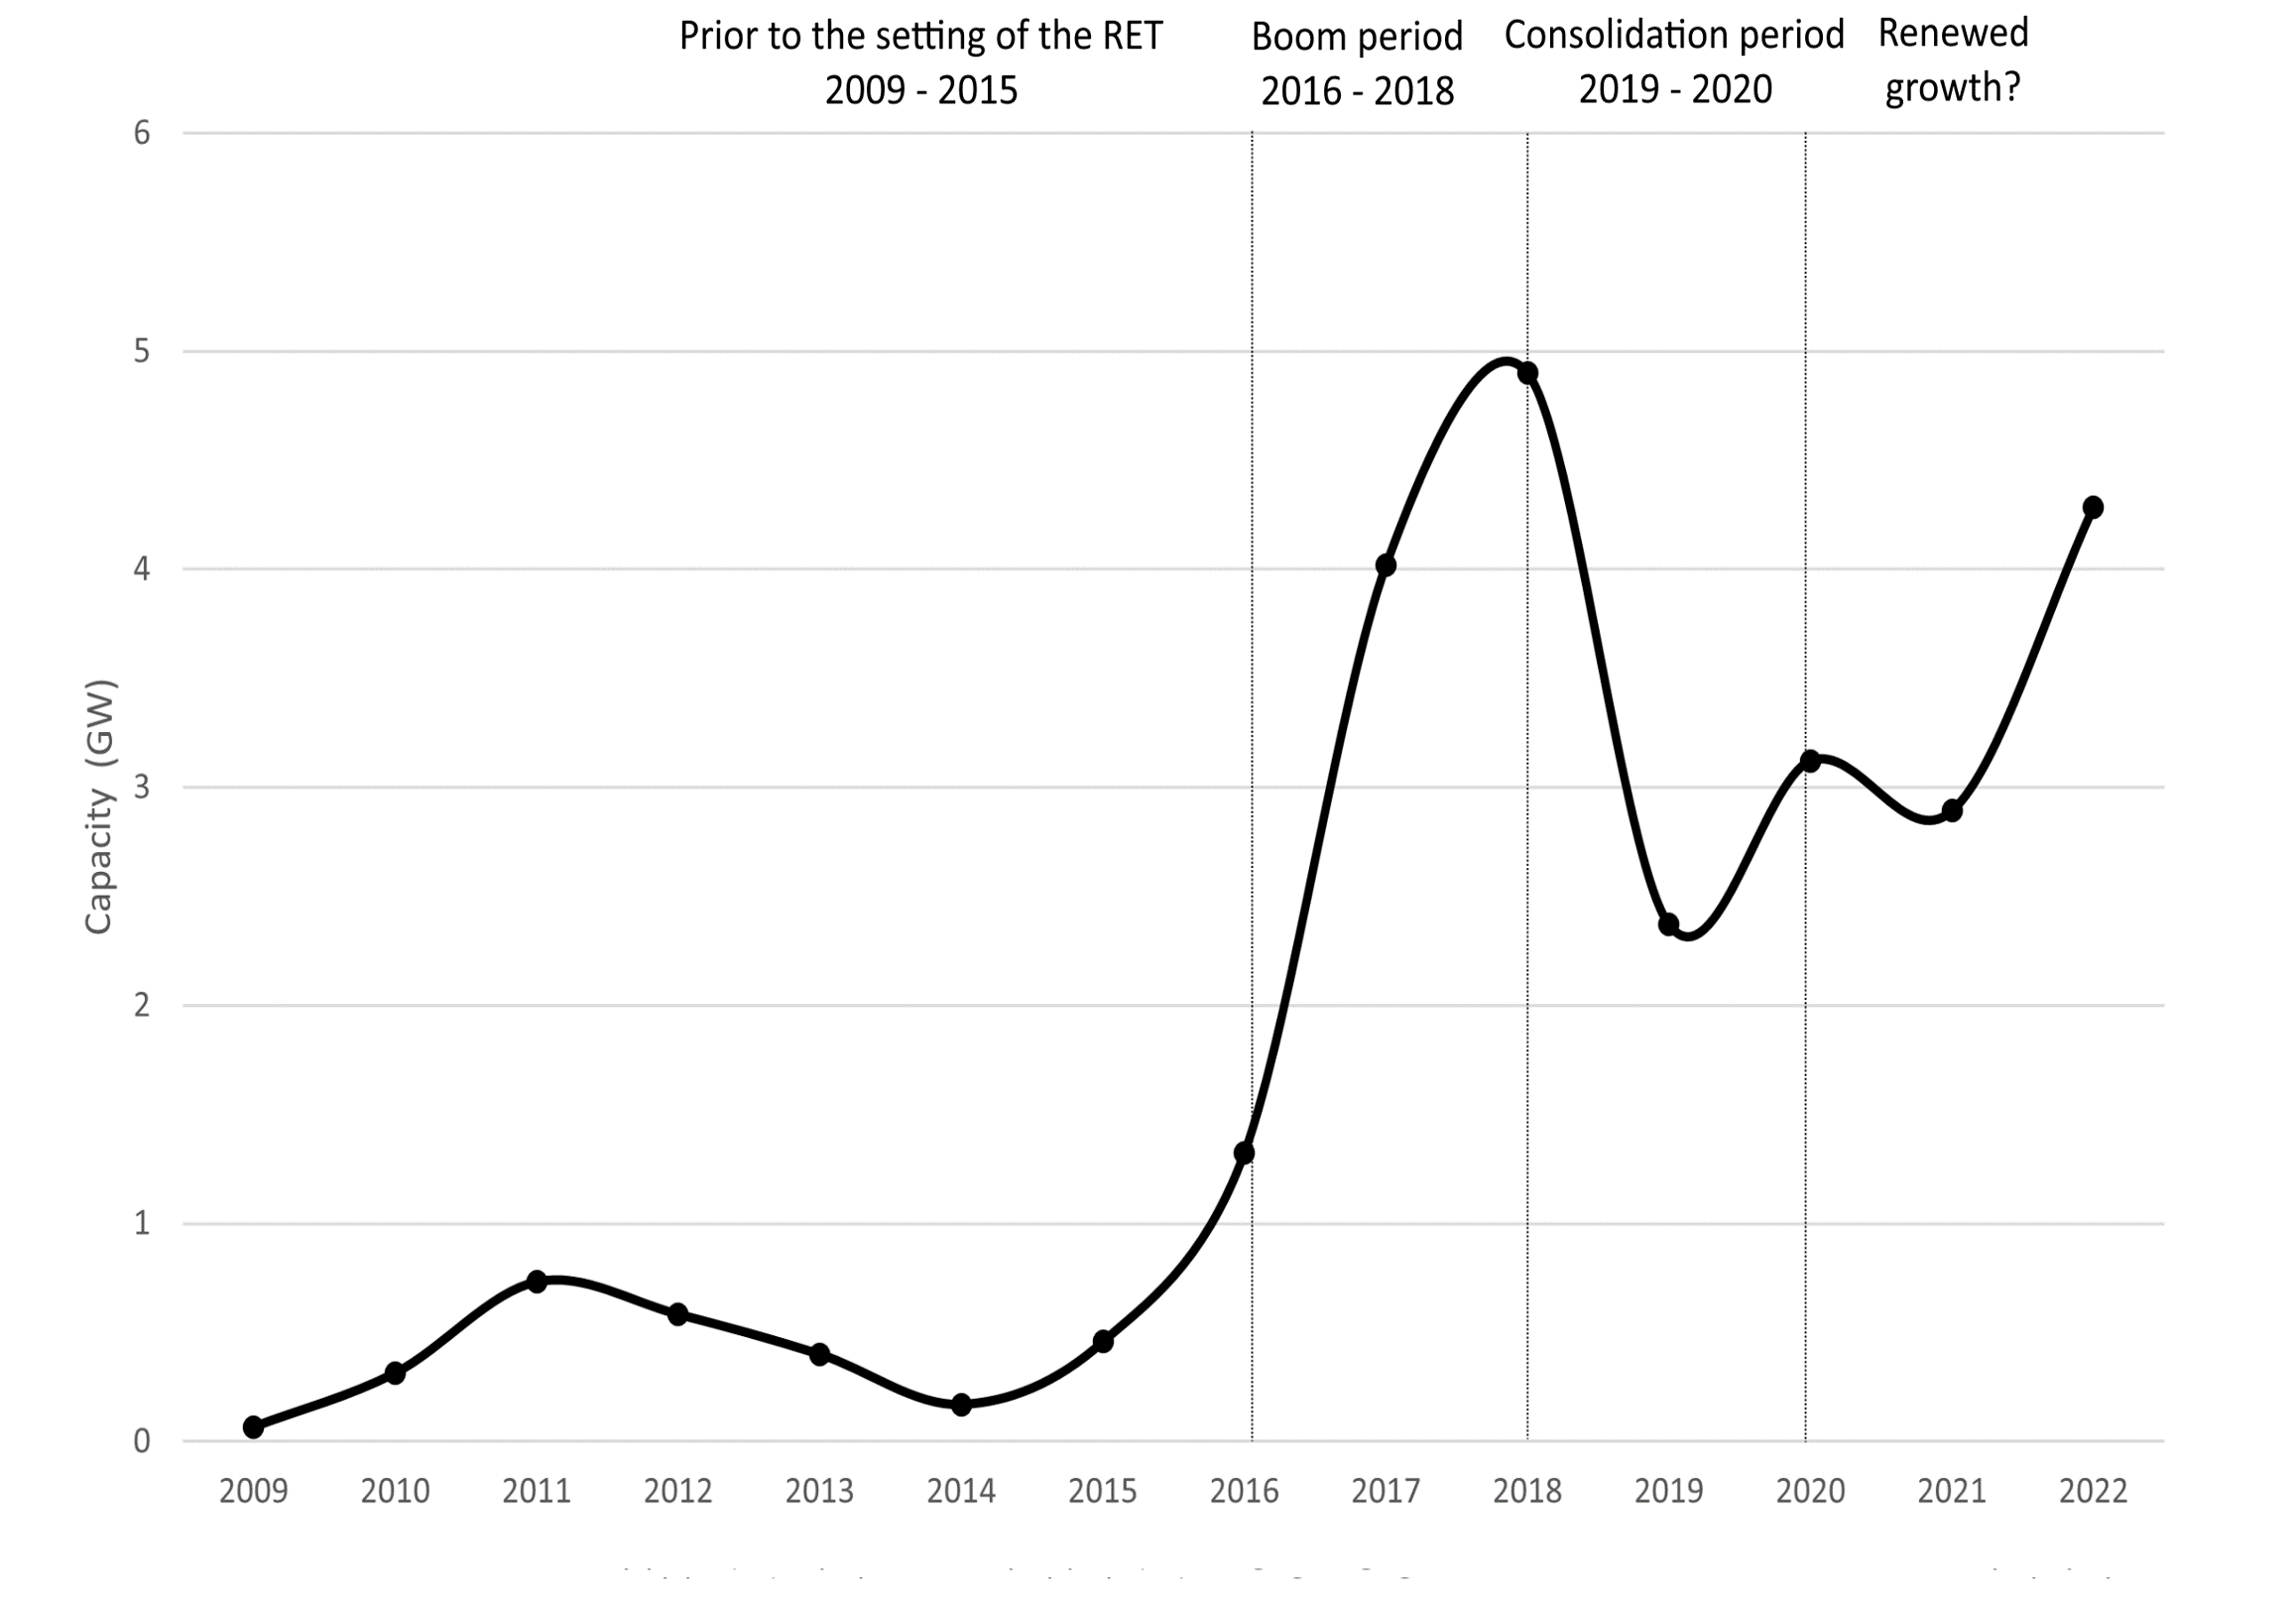
In 2022, the large-scale renewable energy sector responded to strong investment signals with 4.3 GW of large-scale wind and solar projects reaching final investment decision (FID), 2.1 GW of which was committed in Q4 alone. In comparison, an average 2.8 GW reached FID annually over the 2019 to 2021 period.
Key investment signals included:
There are promising signs for the rooftop solar industry as well, which rebounded strongly across the second half of 2022. This resulted in 2.8 GW installed capacity for the year exceeding the CER's expectation set in early 2022 of 2.3 GW. Q4 was the second highest installed capacity quarter on record. A key factor driving these trends may have been increasing retail energy prices. Despite the temporary cap on coal and gas prices introduced in December 2022, retail energy prices appear set for another increase in 2023. 1 This may see increased uptake of solar PV continue through 2023 unless increasing interest rates and tightening household budgets supress demand.
Ongoing state and Australian Government policy announcements on the installation of community batteries will be key watch points for this sector. Batteries will help ease some low voltage distribution network constraints and enable more solar PV to be installed than otherwise possible.
This increase in large-scale renewables and rooftop solar investment are promising developments that can be built on in Australia's journey to achieve 82% renewable generation, and 43% emissions reduction from 2005 level, by 2030.
The 4.3 GW FID capacity for large-scale renewables in 2022 is the second highest annual capacity on record (see Figure 2.1). A new investment boom cycle may be forming, similar to that observed in 2016–2018 when the industry delivered a significant increase in investment to meet the 2020 Large-scale Renewable Energy Target. Future growth will depend on whether supply chains can rebound from constraints that arose from the pandemic and capitalise on the favourable investment environment for renewables.
2009 to 2022 Note: This figure is not interactive.
About this GraphThis graph shows final investment decision capacity of large-scale renewable energy power stations yearly.
The CER tracks public announcements and the above information may not be complete and may change retrospectively.
Data as at 31 December 2022.
Investment signals indicate a strong outlook for future renewable energy investment. The increase in FID capacity announcements is expected to continue in 2023. As highlighted in Figure 2.1, the renewables industry scaled up investment significantly from 2016 to 2018. Much of this investment was delivered between 2016 and 2020. Whether the industry can again scale up to enable an increased level of investment decision in 2023 and beyond, off the back of the big step up in H2 2022, remains to be seen.
For projects to reach FID, engineering, procurement and construction (EPC) contracts and contracts to procure key components are needed at commercial costs. Potential supply chain constraints for contractors and components represent the key risks to ongoing increases in investment. Some are arguing that incentives such as the Inflation Reduction Act in the United States of America will skew investment away from Australia. However, there are many large international renewables developers in Australia who have serious proven intent to invest here. Time will tell how these forces play out.
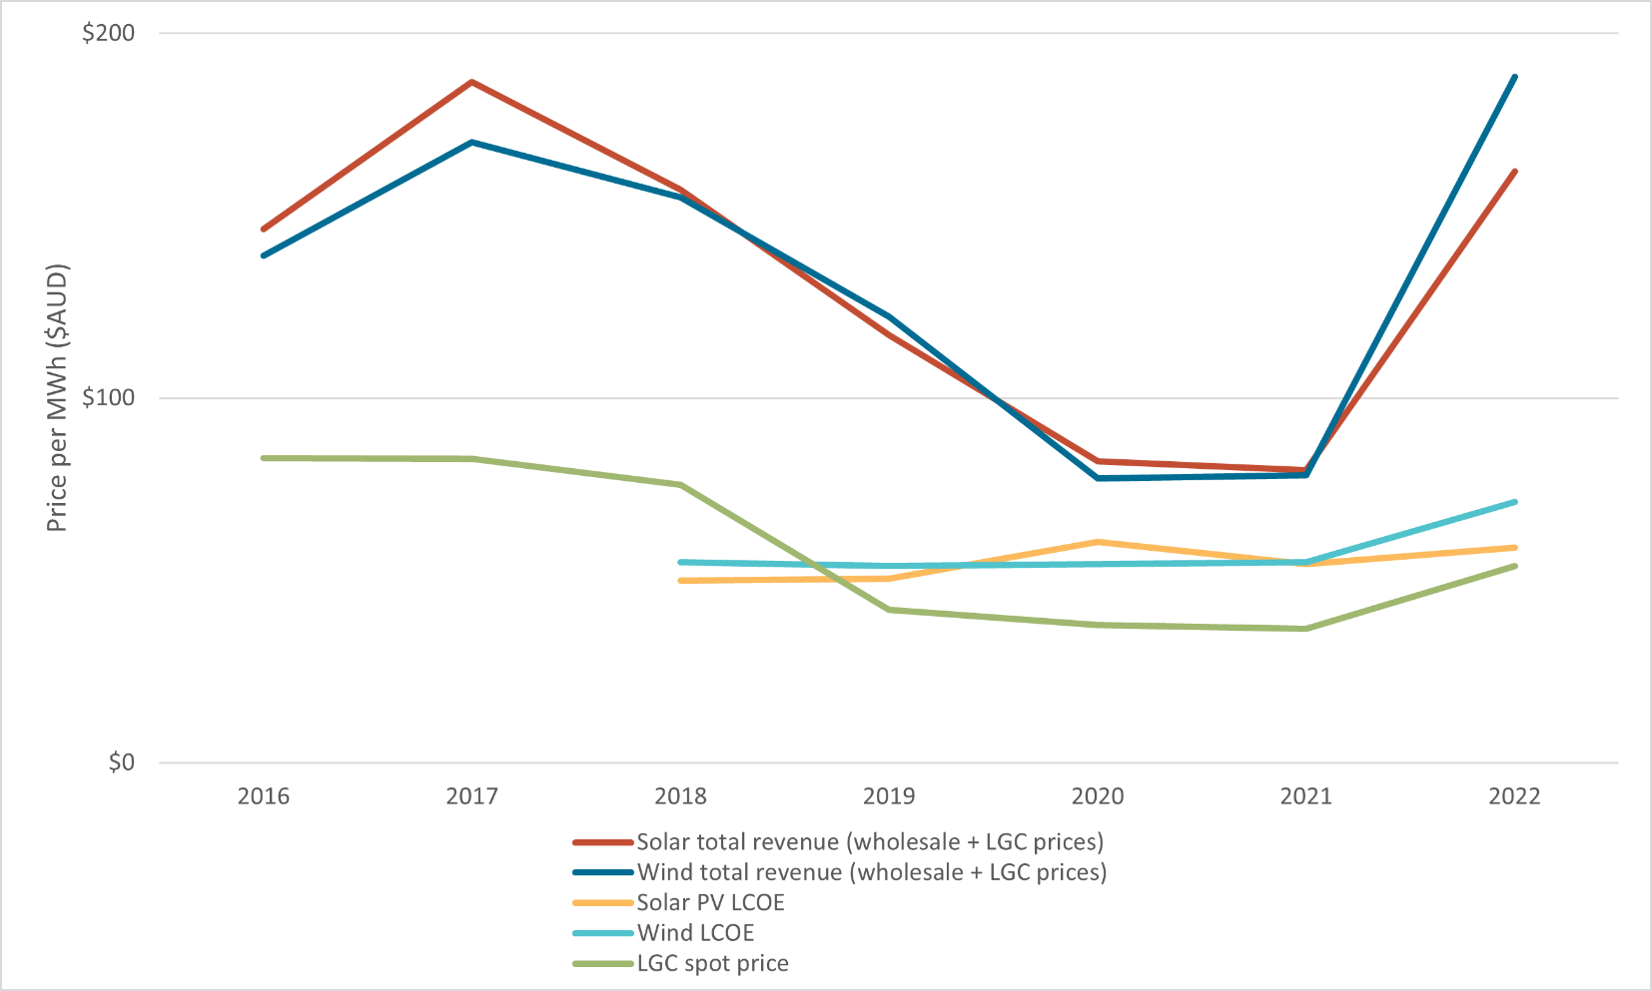
2016 to 2022 Note: This figure is not interactive.
About this GraphThis graph shows the LGC spot price, NEM whole prices and levelised cost of electricity estimates for large-scale wind and solar PV generation.
Spot trade data is compiled from trades reported by TFS Green and may not be comprehensive. NEM wholesale price is compiled from OpenNEM on 3 January 2023. Levelised cost of electricity (LCOE) compiled from CSIRO Gencost reports.
Commercial processes to get projects to FID take significant time and do not follow a standard pattern. Announcements can vary considerably from quarter to quarter, even in a market that is rising. It is difficult to estimate future FID capacity given the factors previously discussed. However, with all the right investment signals in place, FID may increase again in 2023. Industry analyst Rystad suggests over 12 GW of large-scale wind and solar projects currently hold development approval with another 15 GW at concept or various stages in the approval process. 2 Given the investment environment, many of these projects could progress to FID over coming years.
The dynamics of investment are much simpler in the Small-scale Renewable Energy Scheme (SRES). The decision to invest in rooftop solar is consumer driven. Rooftop solar is an attractive investment for consumers, with average payback periods being as low as 3 years because of rising energy costs. Some jurisdictions and large solar retailers offer no interest loans which may entice new purchases in an environment of increasing interest rates.
However, the lag between signing a contract and installation is dependent on supply side factors, including installers and components as well as approvals. Market intelligence suggests current wait times of 3 to 5 months in some regions as demand outpaces available resources. Consumers who had systems installed in Q4 2022 were likely to have inquired and made investment decisions in Q3 2022. Investment decisions made in late 2022 and early 2023 will not be reflected in the installation data until Q2 2023. These supply chain constraints may limit how much capacity is installed in 2023.
The rooftop solar industry has previously handled higher levels of demand, with more than 6 GW total installed during 2020 and 2021. This supports optimism that the industry can progressively scale up to meet increasing demand.
Renewables contributed 35% of total NEM generation in 2022, up 4 percentage points from 2021 (see Figure 2.3). The year finished strongly with both November and December recording 42% renewable generation in the NEM, compared to 36% over the same period in 2021. Solar performed at a record level in December with 23% of total generation. The CER expects renewables could reach an average of 40% of total NEM generation during 2023.
The rapid increase in renewable generation is bringing the emissions intensity of the grid down. Data from the AEMO Quarterly Energy Dynamics Q4 2022 report shows NEM emission intensity dropped to a record low of 0.62 tCO2-e/MWh by the end of 2022. This decline will continue as more renewable generators come online and coal generators reduce production and eventually exit. Increasing solar and wind generation continues to push down wholesale electricity prices. Solar PV and wind set the price in 17% of Q4 intervals, up from 11% in Q3, and average NEM wholesale electricity prices were down 57% quarter on quarter.
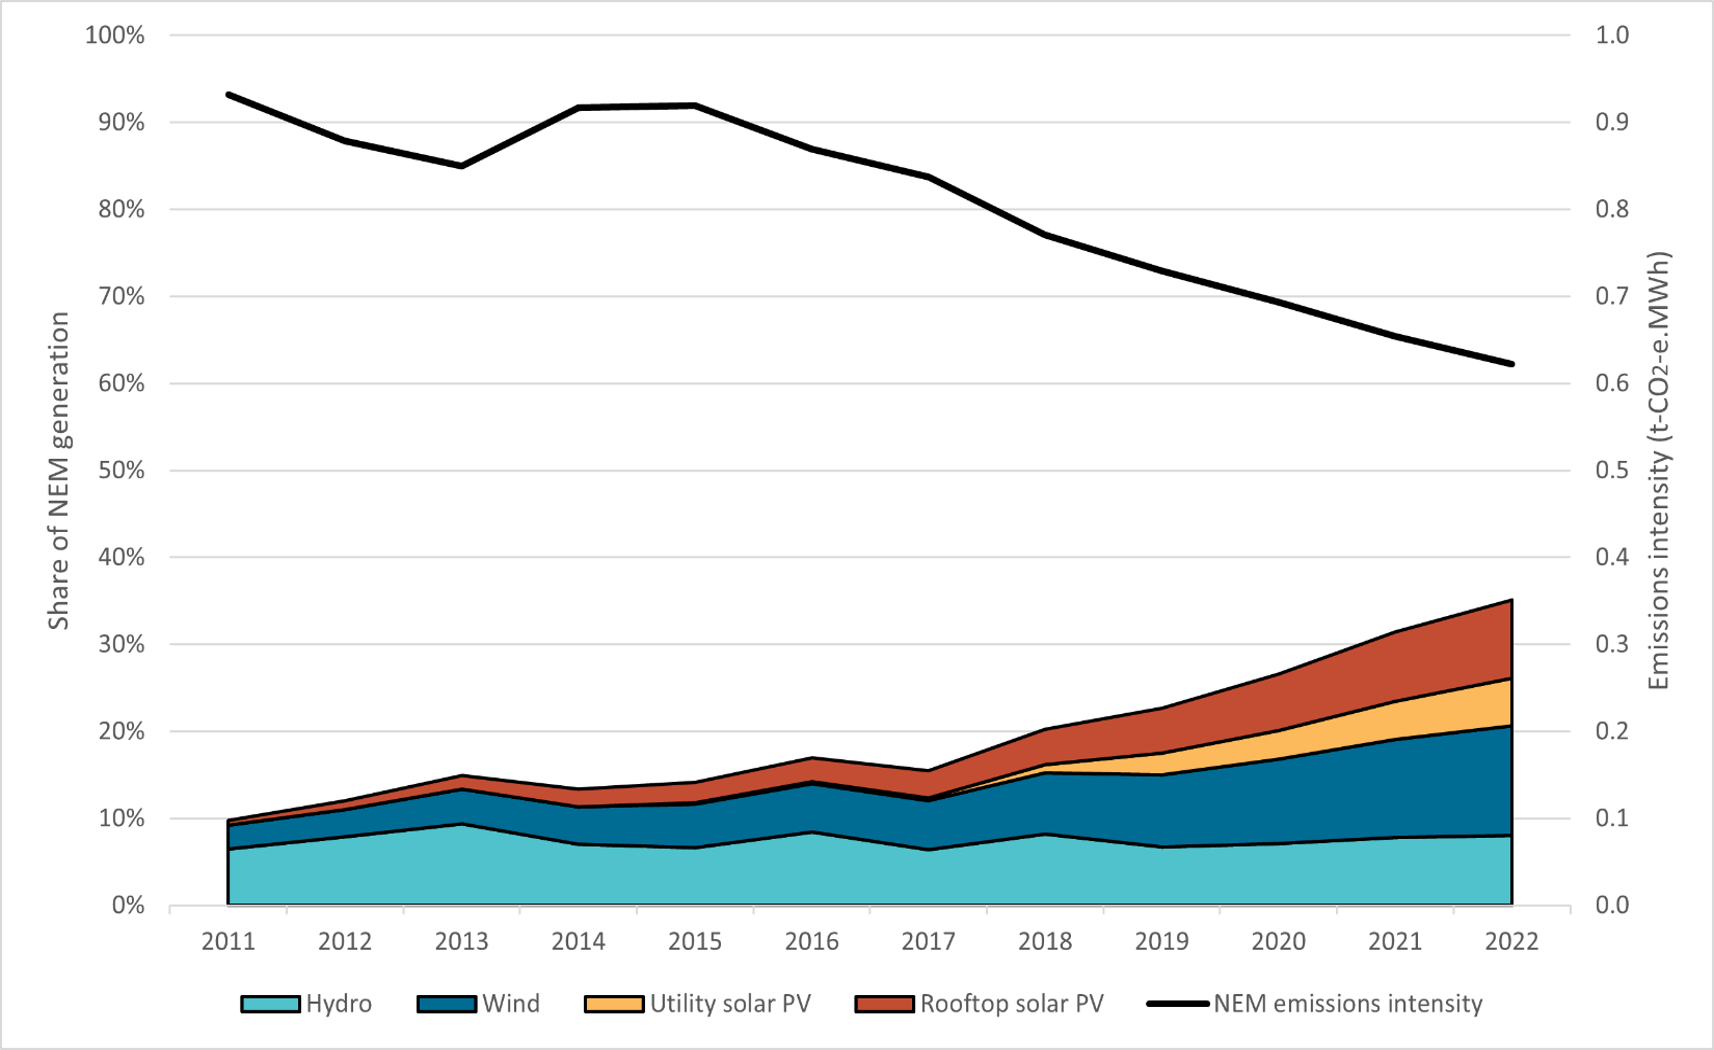
2011 to 2022 Note: This figure is not interactive.